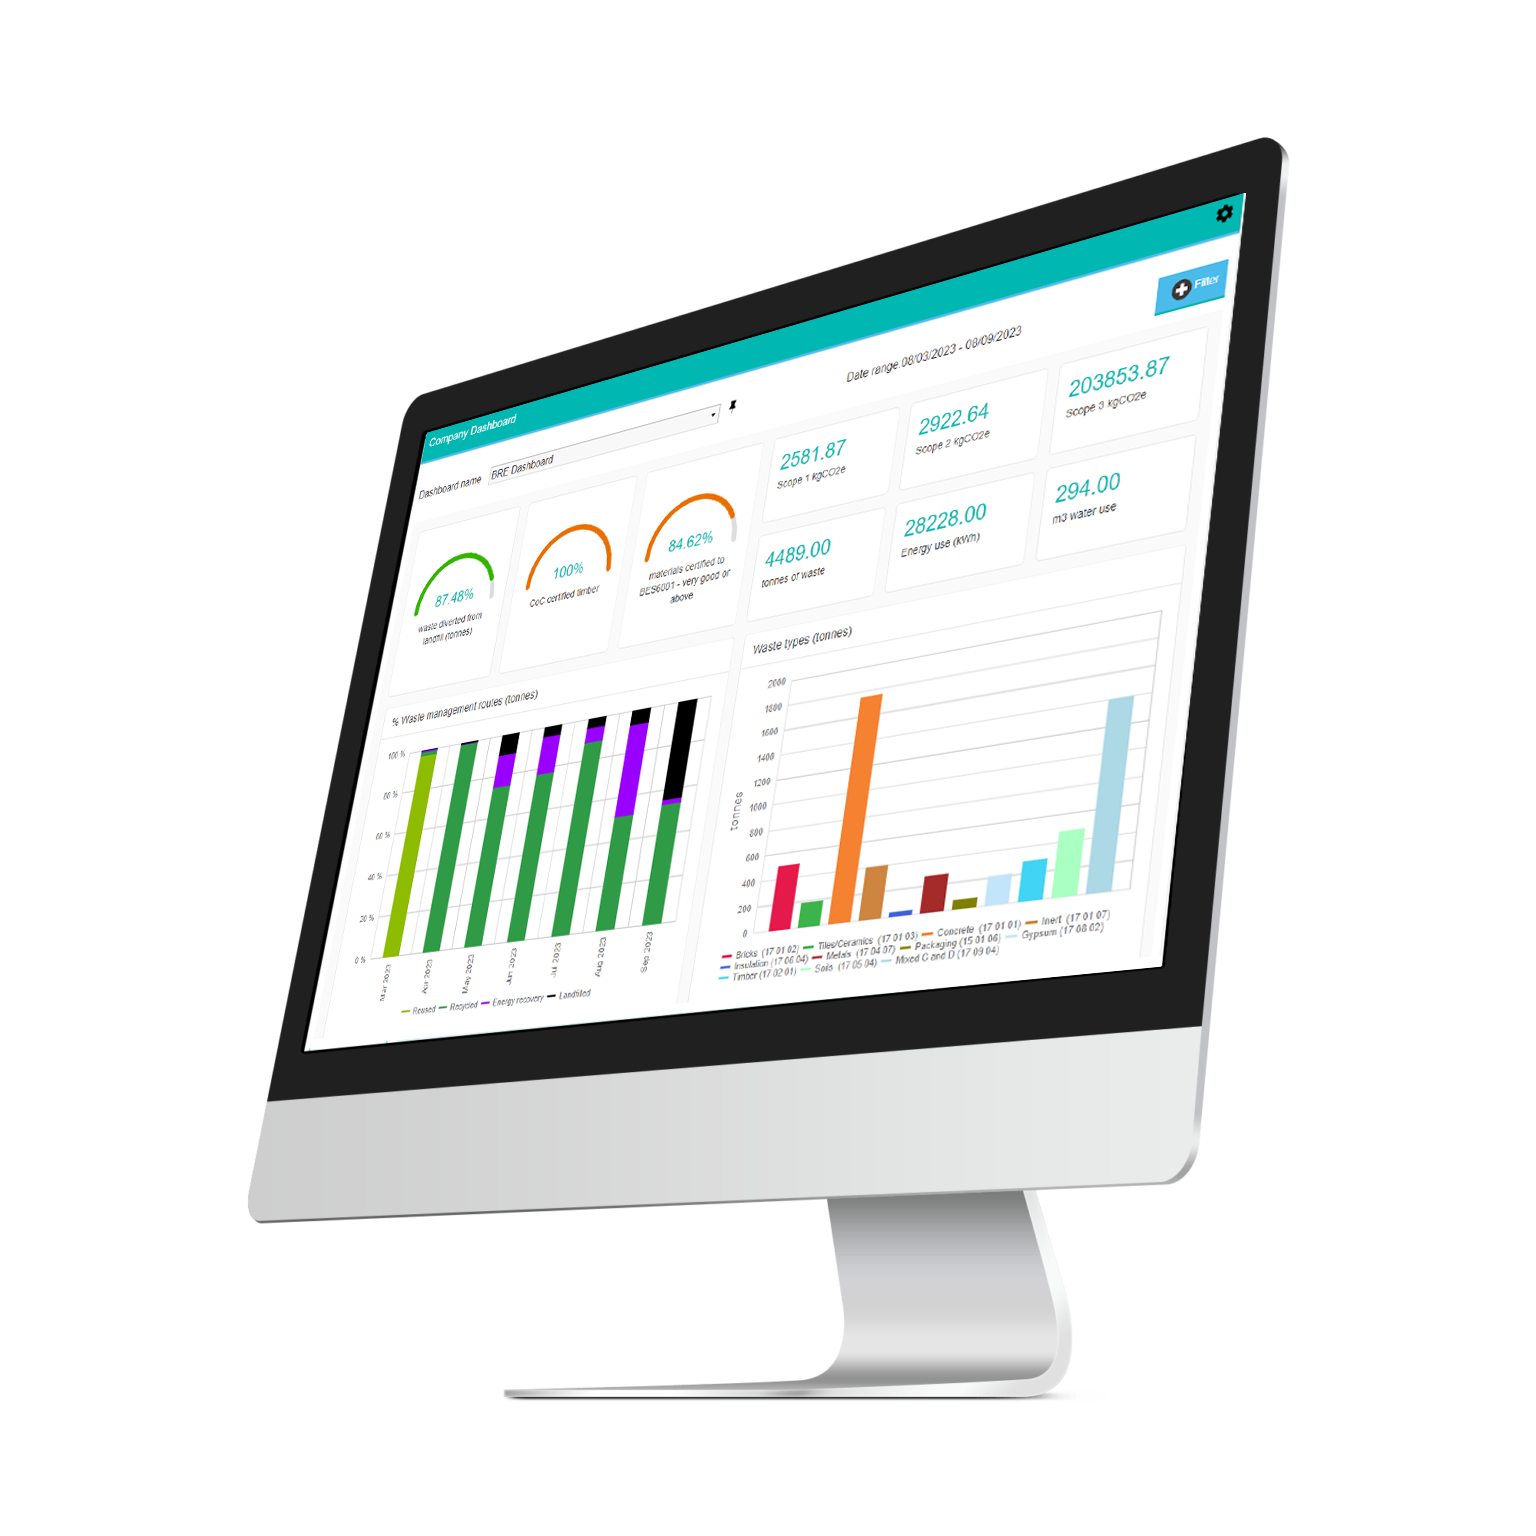
The latest version of SmartWaste brings enhancements to the tool’s KPI reporting capability, helping users keep on top of performance and reduce environmental impacts.
Why it matters…
Key performance indicators, otherwise known as KPIs, are metrics that measure how effectively a project is performing against its goals and strategic objectives. KPIs are therefore used to track the progress of a project and identify how well it is performing.
KPI reporting can be highly valuable, offering several key benefits including:
- Tracking project performance
- Making informed, data-driven decisions
- Collating relevant data in one place
- Benchmarking performance against goals and wider industry
- Communicating performance to stakeholders
In the construction sector, there is an increasing emphasis on the measurement and reporting of environmental and sustainability KPIs. The regulatory, societal and financial landscapes are all shifting to demand greener buildings and infrastructure, with a minimal environmental impact. It is therefore important that you are able to utilise your key project data effectively in order to understand and improve your environmental performance, and demonstrate this performance to stakeholders.
SmartWaste KPIs
SmartWaste provides extensive KPI reporting functionalities, to support users in managing their operational activities. SmartWaste KPIs cover a broad range of issues, including:
- Biodiversity and ecology
- BREEAM
- Carbon
- Energy
- Materials
- Transport
- Waste
- Water
In total, SmartWaste covers more than 120 KPIs, with more added with each update. Users are able to select the KPIs most relevant to their needs and objectives to produce customised reports that can be saved and rerun whenever needed. This saves time and simplifies the output of regular board or management reports.
Custom KPI reports can also be produced at group, business unit and project levels, to meet different reporting needs. These reports can be filtered to display a breakdown of the next level down, enabling easy comparisons to be made:
- At group level, the breakdown filter displays totals for the group and individual values for each business unit, enabling comparison of KPI performance across all business units within the group at once.
- At business unit level, the breakdown filter displays totals for business unit and individual values for each project, enabling comparison of KPI performance across all projects within the business unit at once
How does it work?
Custom KPI reports can be saved as a template and run at all levels, providing more efficient and consistent report creation.
Key features:
- More than 120 KPIs, covering a broad range of topics including:
- Biodiversity and Ecology
- BREEAM
- Carbon
- CCS
- Cost
- Energy
- Incidents, complains and visits
- Materials
- Project Management
- Transport
- Waste
- Water
- Customise reports with relevant KPIs and save and rerun whenever needed
- Custom KPI reports at group, business unit and projects levels
- View KPI totals at group level with a breakdown of business unit values
- View KPI totals at business unit level with a breakdown of project values
- Save custom KPI reports to run at any levels (group, business unit or project)
Key benefits:
- Gather insight on a wide range of topics to benchmark performance and set goals
- Save time producing regular board or management reports
- Flexibility to meet the demands of individual users for KPI reporting
- Enable quick and easy comparison of KPI performance across all business units within the group
- Enable quick and easy comparison of KPI performance across all projects within the business unit
- Use custom KPI report templates for efficient and consistent report creation and to eliminate duplication of effort at all levels: group, business unit and project.
Watch our SmartWaste demo video
Find out why over 20,000 users choose SmartWaste.
SmartWaste insights
Browse the latest insights from SmartWaste – BRE Group

How SmartWaste enhances Modern Methods of Construction (MMC)

SmartWaste and ESG reporting: driving sustainable change

SmartWaste V11: paving the way to net zero carbon and sustainability in construction

Driving the sustainable construction revolution with SmartWaste

25 years of SmartWaste: a journey towards sustainability excellence

